The past two years has put new emphasis on how important an internet connection is to our daily lives. At the same time, some of us have never experienced such slowdowns and erratic performance as in these past two years, coupled with overloading our previously capable home networks. Measuring internet networking performance can help us stay efficient, keep entertained, and remain less frustrated.
Several tools can help you measure or monitor your internet and network performance, and many of them are free. One is even built into macOS Monterey.
Monitor versus measure, internet versus network
Checking in on your network health is always complicated by your position relative to the internet. Within your network, the speed of your connection via ethernet or Wi-Fi can constrain your internet bandwidth.
If you have 1Gbps ethernet throughout your home and your connection to the rest of the world is 1Gbps or less—likely still for nearly all of us—plugging in via ethernet will provide better test results about your internet connection than using Wi-Fi, which can be variable.
Many network tools measure (a single snapshot) or monitor (ongoing samples) data going in and out of a single computer. This includes all data traveling within your local network and that being sent to and received from the internet. This includes macOS’s Activity Monitor (in Applications > Utilities), Peak Hour, and iStat Menus. Peak Hour has the unique ability to also sample bandwidth data from routers and broadband modems that broadcast the information (more on that in a bit).
You can also pick up some information about your network connection in the system Wi-Fi menu. Some routers and broadband modems let you log in and view throughput data or run different network tests.
However, to measure how much throughput you have to and from the internet—the actual real performance of your connection—you have to use a testing tool that interacts with a server somewhere else and then reports on the speed of those interactions. Such tools include Speedtest and the macOS Monterey command-line tool networkQuality.

Monitor your connection
Often your most pressing network need isn’t how fast your connection is, but whether it’s working at all or working well. As my household’s resident 24/7 one-man IT team, I often hear cries of dismay all over the house when something causes our internet to stutter or fail—temporarily or for a longer period.
Having a tool that runs continuously or you can launch on demand to test your current connection can help pinpoint the problem, and lead you to check your ISP’s status page, reboot a Wi-Fi gateway, or make a call to arrange service. These tools offer varying levels of insight and help.
Activity Monitor
macOS’s built-in Activity Monitor has a Network tab, which has a Data chart at the bottom that starts tracking network traffic in and out of your Mac when it’s launched. This can help you begin the journey to see if your Mac is the problem, an individual app, or the network.

Activity Monitor is located in Applications > Utilities. Click the Network tab, which is located in the upper right, next to the Search icon (the magnifying glass).
iStat Menus
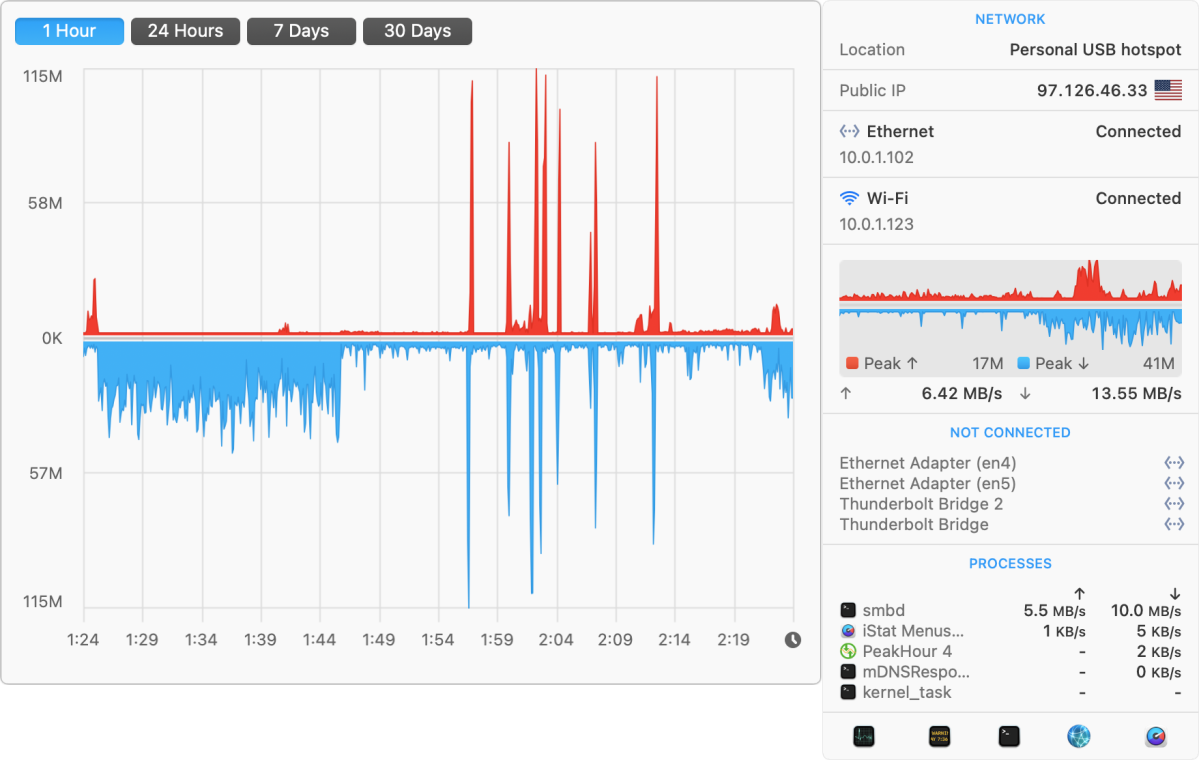
With iStat Menus ($11.99), you can put current network data rates in your menu bar. Click the bar and see a tiny chart of recent activity; hover over the chart and view a larger one with selectable historical data. (We recommended iStat Menus in Mac Gems recently.)
PeakHour
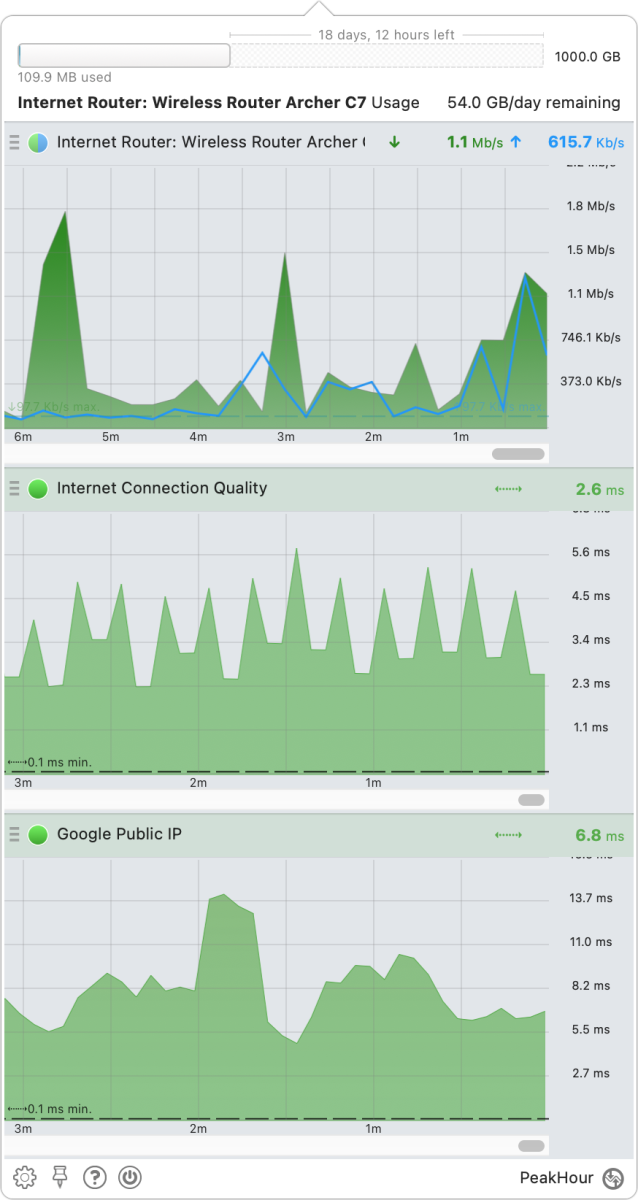
PeakHour (regularly $9.99; currently, $4.99) displays a chart and throughput data in your menu bar and can pull from network sources beyond your Mac. Some routers, like the TP-Link model I use, allow PeakHour to perform continuous network management queries over the local network and receive ongoing snapshots of the throughput for all data entering and leaving your network. You can also use PeakHour to set latency monitors on sites like Google’s Public DNS, which can reveal broader Internet problems.

Measure your internet speed
You can pick one of several tools to perform an internet throughput tests.
Speedtest
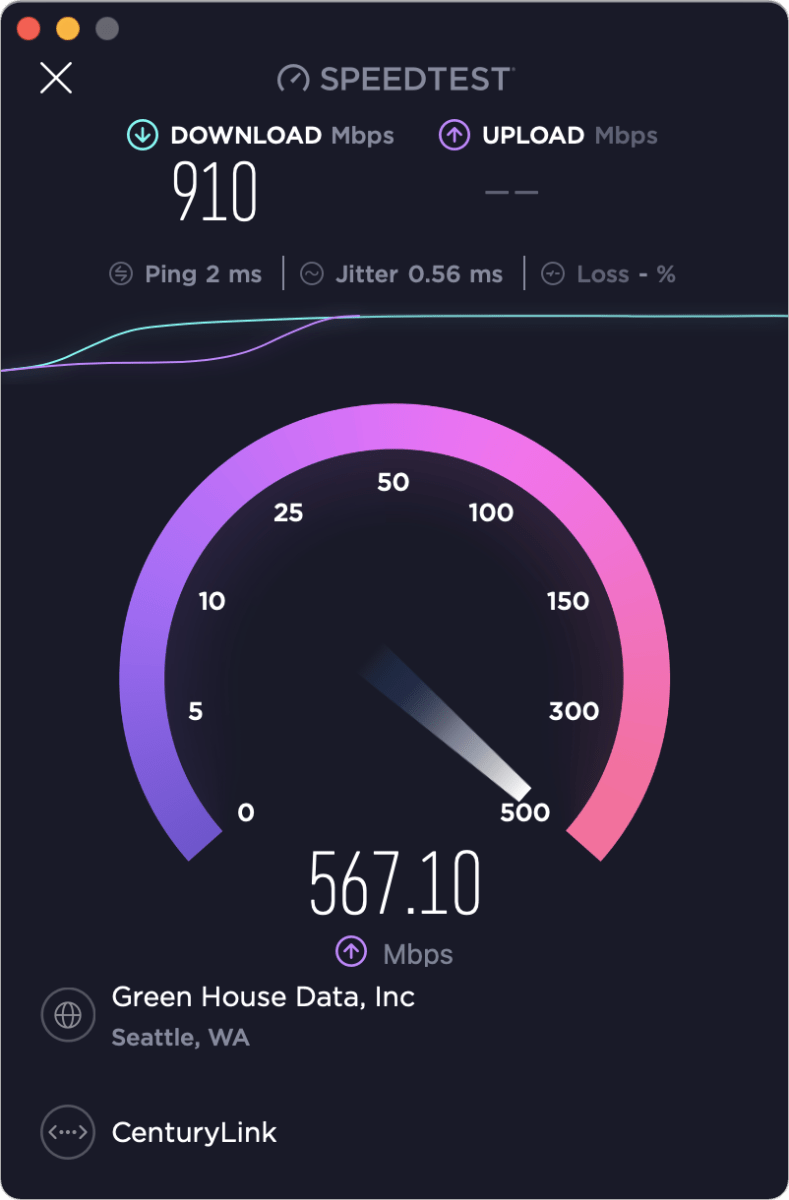
The free Speedtest from Ookla checks latency (see below) and upstream and downstream throughput over several seconds and then averaged. The maker sells aggregated anonymized testing data to ISPs and others. Available as a Mac or iOS/iPadOS app.

macOS Monterey’s networkQuality
The command-line networkQuality tool appeared first in Monterey and lets you run a simple command via the Terminal to test performance. The networkQuality tool produces a straightforward result if you simply enter networkQuality in Terminal and press Return. (Yes, that camel-cap Q must be uppercase.) While it’s running, you’ll see a line like this:
current download capacity: 139.731 Mbps - current upload capacity: 154.199 Mbps
When complete, the tool prints the following text (with your numbers):
==== SUMMARY ====
Upload capacity: 526.274 Mbps Download capacity: 514.126 Mbps
Upload flows: 16
Download flows: 20
Responsiveness: High (2823 RPM)
RPM stands for “round-trips per minute,” a measure closely related to latency. Latency tracks how long in seconds it takes for a data packet sent by a tool to be received by a service on the other end, a response generated, and then received back by the tool. Latency of a few to a few tens of milliseconds (ms) is ideal for interactive communications and games. Closer to 100 ms and responsiveness becomes low and video calls or gameplay may stutter or become herky-jerky.
RPM is another way to think about latency, as it’s the sequential number of operations that can be performed per minute. Measuring RPM requires a longer test than that typically used for latency. Thus latency may show you the round-trip speed average over a few seconds and RPM provides a total number of data round-trips performed one after another over a minute. If your network or Internet connection has a lot of hiccups and dropped packets, RPM offers better insight than a latency snapshot.
Macworld contributor Jason Snell created a way to see output from networkQuality in your menu bar with a third-party utility that lets you add items.
Web-based tests
Many sites offer web-based throughput testing, including Ookla’s Speedtest, Fast from Netflix (which has an interest in helping you figure out if you can’t stream effectively), and Google and Measurement Lab (in support of Google Stadia). Several ISPs feature speed tests, but they almost all license their technology from Ookla.
Solving network woes
If you’re having network throughput issues, you can work through a series of quick troubleshooting measures based on how you’ve isolated the problem.
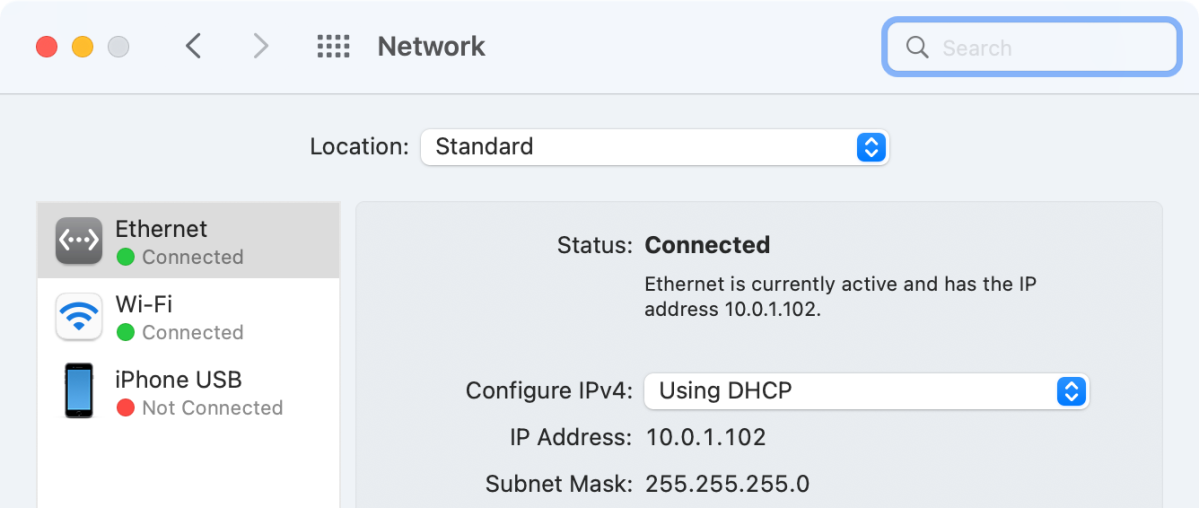
Is it your Mac? Using the monitoring and measuring tools above, you may be able to isolate it. Check that you’re connected via Wi-Fi. Use the Network preference pane to ensure you see a green dot next to your network connection. Disable and re-enable Wi-Fi to reset its state. Restart your Mac if necessary.

Is it a router on your network? Try to log in to each router and view its status. Many manufacturers offer a single tool for Wi-Fi and connection gateways that lets you see network health, such as TP-Link’s Tether and apps for configuring Amazon Eero and NetGear Orbi. Restart one or more routers if they’re not responsive.
All your devices and routers are responsive, but you can’t reach the internet? Log into your broadband modem, if you have access, and see what it reports. If you can’t access the modem, that may be a problem. Otherwise, use a cell connection to consult your ISP’s status page and run through troubleshooting. Some ISPs provide a tool that lets you reset your connection via a website without having to stay on hold for an hour and answers questions that are often terribly out of date about your Mac and network devices.

from Macworld.com https://ift.tt/3ApIpIK
via IFTTT


0 Comments